The
Finished Goods Series ™
from E/Step Software Inc.
from E/Step Software Inc.


|
The right inventory needs to balance conflicting goals:
|
The Inventory Planning module computes what inventory you ought to have, by SKU (Stock-Keeping Unit—an item at a location). In its Simulation program, FGS shows you the impact on inventory of each of your forecasting decisions—before you commit to them. Seeing the effect on inventory is the best way to evaluate decisions.
FGS helps you break through the conflicting goals of an inventory manager and improve on all fronts. It helps you to easily evaluate many inventory strategies so management can help select the best policy to achieve the business plan.
FGS helps you calculate how much inventory to order and how much to carry:
FGS displays both tabular and graphical tradeoff curves between service and inventory—in effect, computing a price for service—eliminating the guesswork which often determines inventory levels. This means you can plug in your target service level and let FGS compute the inventory necessary to achieve it; or you can enter your inventory budget and FGS will tell you how much customer service you can afford.
Many companies use the traditional fixed-time-supply method to set their inventory levels, e.g. 6 weeks of safety stock for all items. This method fails because it is not directly related to service. FGS contains this capability (it's one of the six available inventory strategies), but uses it just for comparison purposes (so you can see how poorly it performs).
|
Compare 3 measures of service. |
With the far superior statistical equal service rule, users can typically expect to save at least 25% of their safety stock for the same level of customer service! This method gives all SKUs the same service. Compared to the fixed time supply method, it always reduces inventory or improves service, and usually both. It takes away inventory from SKUs with short lead times and good forecasts, and invests it in SKUs with longer lead times and poorer forecasts. The remainder is inventory reduction. But you can do even better using service optimization…
FGS also includes three optimization rules which guarantee the least possible inventory for the chosen aggregate customer service target. Or, for a given inventory target, they guarantee the highest possible customer service. Optimization typically saves another 5% to 50% of your safety stock inventory when compared to the equal service rule! What you optimize is up to you. You can decide to minimize
Don't sub-optimize! The classic EOQ calculation is a perfect example of sub-optimizing the working stock at the expense of service.
There is also a user-defined measure of service and accompanying optimization rule which allows you to maximize
FGS lets you target your inventory and service where needed, by maintaining as many different service groups as you wish. Service and inventory are set at the user-defined SKU level, which means you can set different service levels by market, product line, location, end use, customer, or anything else you define. The inventory computed for each service group considers individual forecast errors, lead times, costs, service levels, and replenishment frequencies. This means you have higher inventory where your forecast error is high, not—as is typical—where your forecast is high.
Example of setting service in FGS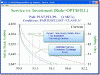 |
FGS' Inventory Planning helps you answer the questions:
This example shows that the current time supply rule of 10.4 weeks of safety stock costs $4 million and provides service of 96.4%. For the same investment using the Optimized Dollar Fill rule, 99.5% service could be realized. Or for the same level of service, the investment could drop down to $2.6 million or 6.8 weeks.
The graph is a representation of the same service vs. investment alternatives. Each of the three colors represents a different service measurement technique. The current fixed time supply policy is circled but not on the curve. There is over a $1.5 million opportunity here.
What is the cumulative lead time?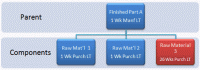 |
By calculating the right safety stock at lower levels in your bill of
materials, you can reduce your cumulative lead times and finished
inventory. Keep the right inventory levels for long lead time components
or bulk intermediates. Click on the example (right).
If you have a strong seasonal demand pattern you might want to consider using safety time. It still calculates a statistical safety stock, but expresses it in terms of time. So as you approach the peak of the season your safety stock will be the greatest. In the low period, it will be smaller.
For an excellent article written in more detail, read The Right Service at the Right Price, a presentation by John Estep, CFPIM, to the INC Magazine Growing Your Manufacturing Company Conference, Phoenix, AZ, May 1998.